
Can Global Mean Temperatures be Held to 1.5°C or Less Without Major Efforts in Carbon Removal / Geoengineering?
Donald J. Wuebbles
Abstract
The 2015 international Paris Agreement called for pursuing efforts to limit the changes in climate to 1.5°C above pre-industrial levels. Various studies since then, including a special study by the international Intergovernmental Panel on Climate Change evaluated the possibility of achieving this goal and found it may still be possible. More recently, with no significant reductions in the emissions driving climate change, a variety of questions have arisen about whether global mean temperatures can be held to 1.5°C during this century. This study uses several different approaches to reexamine this feasibility more fully. The observed trends in the temperature record provides one means to estimate when 1.5°C will be reached. Examination of the remaining allowed carbon emissions after December 2022 as an update to IPCC (2021) provides another approach. The temperature record and the observed trends in temperature over recent decades suggests that 1.5°C will be reached in one to two decades, by 2032 to 2042. Consideration of the equivalent amount of CO2 reveals a range of 266 to 531 GtCO2-eq still allowed for 67% to 33% probability, respectively, of staying within the temperature limit. For a 50% likelihood of staying at 1.5°C or less, allowed emissions would be 366 GtCO2-eq. At the current rate of emissions, 45 GtCO2-eq for 2022, the limit would be reached in 8 years. If an emissions reduction of 4% per year beginning in January 2023 is considered, the 67% likelihood for staying within the 1.5°C limit is passed in 2030 and the 50% likelihood is passed in 2035. Based on both the temperature trend analysis and the remaining carbon analysis, humanity is very unlikely to meet the identified targets needed to keep the global temperature change to 1.5°C. As a result, the SSP1-1.9 scenario assumptions for future emissions towards enabling a limit of 1.5°C are also extremely unlikely unless affordable, rapid, and technically feasible improvements in geoengineering approaches are developed and safely implemented.
Introduction
The goal of the United Nations Framework Convention on Climate Change (UNFCCC) – officially adopted at the Cancun Convention of the Parties in 2010 (UNFCCC 2010) – has been to limit a global mean surface temperature increase to 2 degrees Celsius (°C) or less relative to preindustrial temperatures. The Paris Agreement (UNFCCC 2016) then established a goal to “Holding the increase in the global average temperature to well below 2°C above pre-industrial levels and pursuing efforts to limit the temperature increase to 1.5°C above pre-industrial levels…” (Article 2.1(a)). This global change in climate is often interpreted as starting duringrelative to the average global temperature during the period from 1850–1900 when adequate global temperature records began to be compiled and collected, but as discussed later there remain questions about the choice of reference period.
This goal of achieving 1.5°C has been interpreted differently in a variety of different studies (e.g., Schleussner et al. 2016; Rajamani and Werksman 2018; Mace 2018) – for example, must 1.5°C be achieved by 2100 or can it be 2150 or later, can there be an overshoot with temperatures over 1.5°C before returning to 1.5°C, when must major cuts in emissions start and how large can those cuts per year be, or how large might negative emissions be assumed due to carbon removal in the latter half of the 21st century.
A clear goal to minimize the impacts of climate change on human society and ecosystems would be to aim for limiting average global warming to 1.5°C or 2°C with a high probability of staying below the given temperature, with no overshoot. Some analyses, including most of the studies using the simplified Integrated Assessment Models (IAMs), have considered a series of possible scenarios with different degrees of overshoot in temperature before the warming limit is reached by a given date (e.g., 2100 in Rogelj et al 2018a, b). Any overshoot in the temperature would also correspond to more significant climate changes over multi-decadal time scales. Towards avoiding the additional potential impacts of such overshoots, it is worthwhile to consider when 1.5 or 2°C is first reached.
The international Intergovernmental Panel on Climate Change (IPCC 2018) commissioned a special report to assess the understanding of keeping the globally-averaged temperature at or below 1.5 °C above pre-industrial levels and to relate this temperature change to the global greenhouse gas emission pathways, in the context of strengthening the global response to the threat of climate change, sustainable development, and efforts to eradicate poverty. The 2018 report highlighted a number of climate change impacts that could be avoided by limiting global warming to 1.5°C compared to 2°C, or more. For instance, by 2100, global sea level rise would be 10 cm lower with global warming of 1.5°C compared with 2°C. The likelihood of an Arctic Ocean free of sea ice in summer would be once per century with global warming of 1.5°C, compared with at least once per decade with 2°C. Coral reefs would decline by 70-90 percent with global warming of 1.5°C, whereas virtually all (> 99 percent) would be lost with 2°C. However, the study also found that limiting global warming to 1.5°C would require “rapid and far-reaching” transitions in land, energy, industry, buildings, transport, and cities. As discussed later, scenarios for future climate changes have been developed to enable examination of a range of potential future climates, including one where global temperature change stays at or below 1.5°C. In this scenario, global net human-caused emissions of carbon dioxide (CO2) would need to fall by about 45 percent from 2010 levels by 2030, reaching ‘net zero’ around 2050. This means that any remaining emissions would need to be balanced by removing CO2 from the air.
The question is, five year later, is maintaining the temperature change to 1.5°C still feasible? The IPCC AR6 (Assessment Report 6) WG1 Report (IPCC 2021) and other studies reexamined the emissions since the 2018 report and concluded that 1.5°C was unlikely but still possible. Since then, various news stories have concluded that limiting to 1.5°C was even less likely (e.g., https://www.newscientist.com/article/2323175-the-worlds-1-5c-climate-goal-is-slipping-out-of-reach-so-now-what/, https://www.theatlantic.com/science/archive/2022/04/un-ipcc-1-5-degree-report-global-warming/629486/; https://www.scientificamerican.com/article/the-world-will-likely-miss-1-5-degrees-c-why-isnt-anyone-saying-so/).
The aim of this study is to use several different approaches to more fully reexamine the feasibility of limiting human-driven climate change to 1.5°C. The observed trends in the temperature record provides one means to estimate when 1.5°C will be reached. The 2022 remaining allowed carbon emissions as an update to IPCC (2021) provides another approach. Other factors that may affect the interpretation of each of these analyses are also considered.
Global atmospheric temperature trends
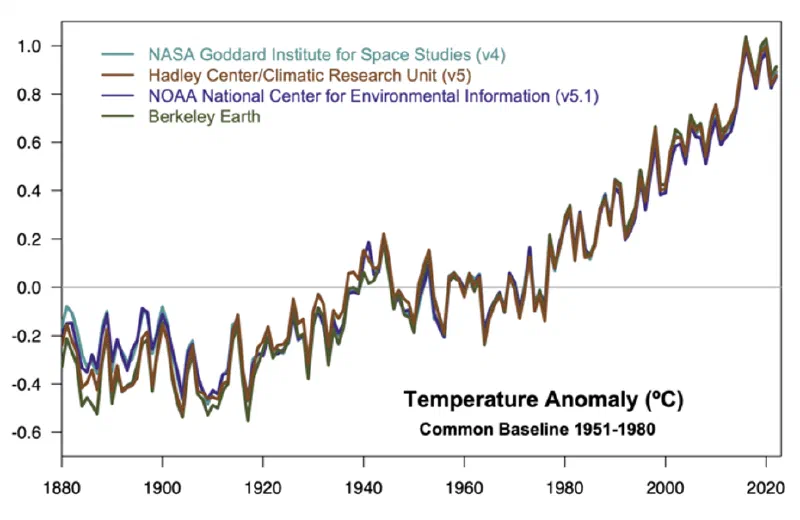
Figure 1 shows the analyses of the surface temperature record through 2022 done by four different organizations (NOAA National Center for Environmental Information version 5.1; NASA Goddard Institute for Space Studies version 4; UK Mmeteorological Office Hadley Centre HadCRUT.5.0.1.0; and Berkeley Earth, e.g., see Rohde and Hausfather (2020)). With its release (version 5.1) in January 2023, the new NOAA Merged Land Ocean Global Surface Temperature Analysis (NOAAGlobalTemp, NOAA, 2023b) combines long-term sea surface (water) temperature (SST) and land surface (air) temperature datasets to provide full global coverage since 1850 as compared to 1880 in earlier NOAA datasets. The NASA and Berkeley Earth datasets, and now NOAA, are fully global (by better accounting for the polar regions) while the UK Hadley Centre dataset does not include high latitudes. The additional Arctic surface temperature data have brought the different analyses into even better agreement than seen before. Some differences remain before 1940 because of sea surface temperature inhomogeneities and in the 19th century because of data sparsity. Overall, there is strong agreement in the different evaluations of the global surface temperature record.
Figure 1 shows that the different approaches result in very similar trends. These datasets also show that landmasses are generally warming at approximately twice the rate of the ocean and the Arctic is warming at twice the rate of the rest of the world. Nonetheless, the choice of record(s) will make a slight difference as to what temperature change has been reached.
The El Niño / La Niña Southern Oscillation (ENSO), a strong irregular natural interannual pattern in the tropical Pacific, influences the interannual variability of the climate system, including global weather patterns and the annual mean temperatures. During years dominated by El Niño years conditions (e.g., 1998, 2010, 2016), global temperatures tend to be warmer than ENSO-neutral or La Niña years, while global temperatures tend to be slightly cooler during periods of cold phase La Niña years (e.g., 2011, 2018, 2021, 2022).
Depending on the analysis, 2020 was either the first or the second warmest year on record, essentially tied with 2016, since nearly global observations of temperature began in the mid-1800s. Despite this last year being the 3rd straight year dominated by La Niña yeconditionsar, 2022 was the 5th or 6th warmest year on record, depending on which analysis is used. The longer-term decadal climate trend continues to increase and the last nine years have been the warmest on record (NOAA, 2023a,b).
One of the factors in determining when 1.5°C will be reached is the reference time period. There is no perfect reference period, but if the aim is to account for CO2 emissions since the industrial revolution began in the 1700s, then there should be additional CO2 emissions and associated pre-1850 warming (Hawkins et al. 2017). However, as discussed in IPCC (2021), the impacts that are expected at 1.5ºC are derived in large part from the CMIP model simulations that have a nominal baseline of ~1850, ‘pre-industrial’ temperatures are usually assumed to be some kind of mid-19th cCentury average. The analyses of Hawkins et al. (2017) suggest that using the 1750-1800 time period would add as much as a few tenths of a degree to the derived estimates for global temperature change. Despite this uncertainty, almost all of the major changes in globally averaged temperature have occurred since the 1850–1900 time period. As a result, most existing analyses of temperature changes are based on the time period beginning in the mid- to late-1800s.
Evaluation of the absolute change in global temperature depends on which datasets and analyses are used. IPCC (2021) found that the global surface temperature was 1.09 [0.95 to 1.20] °C higher in 2011–2020 than the pre-industrial (1850-1900) levels. By extending these analyses through 2022, the World Meteorological Organization (2023) evaluation of the surface temperature analyses found the average global temperature in 2022 was about 1.14 [1.02 to 1.27] °C above the 1850-1900 period.
The prior analyses of the temperature record by NOAA showed a linear increase of 0.18°C since 1981 (NOAA 2023a). All of the analyses, as shown in Figure 1, indicate that the trends since 1996 show a linear increase that is robustly over 0.2ºC/decade (Schmidt 2023). While trends in temperature may decrease in the coming decades, the continuing growth at this time in radiative forcing (WMO 2023) suggests that the temperature trend is unlikely to decrease significantly over the next two decades. Given this, 1.5ºC should be reached in less than two decades from now. By considering the uncertainty range in the long-term temperature evaluated from WMO (2023), the limit will be reached within one to two decades, sometime between 2032 to 2042.
The 2023 year is starting with a mild La Niña conditions, which is being forecast to switch to neutral conditions by mid-year and perhaps to an El Niño conditions developing towards the end of the year. If so, 2024 could be thelikely set a new global average temperature record year. This, in itself, will not result in the longer-term average climate trend reaching 1.5ºC, but could result in the time to reach 1.5ºC to an earlier part of the 2032 to 2042 time period and conceivably even sooner.
Allowed carbon emissions towards the 1.5°C target
This section examines the amount of CO2 in units of gigatons of CO2 (GtCO2), that could still be emitted into the atmosphere by human activities without exceeding global mean surface temperature increase of 1.5°C. Additional carbon emissions can determine whether 1.5°C will be reached, but by themselves do not determine exactly when 1.5°C will be reached. The specific year depends on the feedbacks in the climate system and on weather related factors like such as ENSO.
A variety of estimates exist in the scientific literature on the amount of carbon emissions that would limit global mean temperature to below either 1.5 or 2°C. These are usually given with an associated range of probabilities, generally between 33%, and 67%, of staying at or below the temperature limit. These ranges are largely based on the uncertainty in the equilibrium climate sensitivity (ECS), the transient climate response (TCR), and the transient climate response relative to cumulative emissions of carbon (TCRE) (IPCC 2018, 2021). TCRE is the ratio of the globally averaged surface temperature change per unit CO2 emitted. IPCC (2021) assessed TCRE to likely fall in the range of 1.0°C–2.3°C per 1000 GtC (note that 1000 GTC = 3664 GtCO2).
The uncertainties of these depend on short-term feedbacks affecting climate change over the next few decades, as well as the longer-term equilibrium feedbacks (which are associated with long-term changes in land ice and the ocean), and for TCRE, also on uncertainty in the carbon cycle.
There are several additional factors that require consideration in evaluating future CO2 emission. limits. Since we are already close toapproaching the 1.5°C limit, the remaining carbon budget is small and is quite sensitive to many different factors, including how much observed warming has occurred to date, the amount of non-CO2 emissions and associated climate effects in the future, and the assumed range of transient climate response in calculating probabilities of avoiding a 1.5°C (or 2°C) world. For example, while CO2 is the main driver of human-induced long-term climate change, about one-third of the current changes in climate are due to human-related emissions of other gases and particles (Smith et al., 2020). After the limit in terms of CO2 by itself is evaluated, the contributions of methane and other greenhouse gases are then considered.
The concept of a cumulative carbon budget and the resulting limits on future CO2 emissions to achieve a given temperature goal began to emerge clearly in 2009 (e.g., Allen et al. 2009, Matthews et al. 2009, Meinshausen et al. 2009, WBGU 2009, Zickfeld et al. 2009). It was subsequently featured in international climate assessments (IPCC 2014, 2018, 2021). The conceptual basis is an approximately linear relationship between cumulative CO2 emissions and the resultant temperature response (e.g., IPCC 2018). These studies basically show that every tonne of additional CO2 results in additional temperature change. The concept is sometimes referred to in the literature as an allowed ’carbon budget’, but more strictly is a limit to the remaining cumulative anthropogenic CO2 emissions after a chosen date that result in a specified temperature increase and probability. Based on the well-established relationship between cumulative CO2 emissions and CO2-induced atmospheric temperature change, this concept implies that limiting the total amount of CO2 emitted to the atmosphere is a reliable means of not exceeding some specified temperature target, with a given probability (Matthews et al. 2020). This is not to be confused with another concept, the historical carbon budget, which describes estimates of all major past and contemporary carbon fluxes in the Earth system (e.g., Friedlingstein et al. 2020, 2022).
The remaining carbon budget concept has become well accepted in policy discourse (Lahn 2020) since it represents a relatively easy way of understanding how CO2 emissions contribute to global mean surface temperature change and is a useful tool for communication. The general approach outlined in the literature is shown schematically in Figure 2.
The focus here is on the cumulative carbon budgets, the integrated emissions over time that keep temperature increases below different warming levels and the uncertainty as to when 1.5 °C degrees will be reached. CO2 emission limits estimated by IPCC (2021) are based on the approximately linear relationship between peak global mean temperature and cumulative emissions of CO2 (i.e., the TCRE). The linearity of the TCRE relationship results from the compensation of individual non-linear processes that can increase or decrease the sensitivity of the temperature response to additional cumulative CO2 emissions (Matthews et al. 2020)
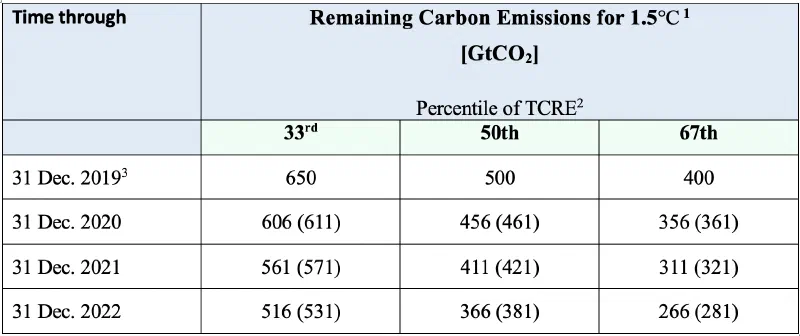
Table 1 starts withshows a summary of the remaining allowed CO2 equivalent emissions (that account for other gases and particles, not just CO2) to reach 1.5°C based on emissions through the end of 2019 from the IPCC (2021). These limits are defined relative to the 33rd, 50th, and 67th percentiles of TCRE, providing an estimate for the range of likelihoods of being able to stay at or below the given temperature change. For example, the 50th percentile means there is a 50% probability of globally averaged temperature staying at or below a 1.5°C increase relative to the 1850-1900 time period. The remaining carbon emissions to January 2020 to limit warming to 1.5°C from IPCC (2021) improve upon previous studies by using a more consistent approach to estimate the remaining carbon budget. In the rest of Table 1, the emissions for the last three years, through Dec. 31, 2022 are subtracted.
Based on an approach proposed by Millar et al. (2017), IPCC (2018) used a composite of the observational records to use as a best estimate.
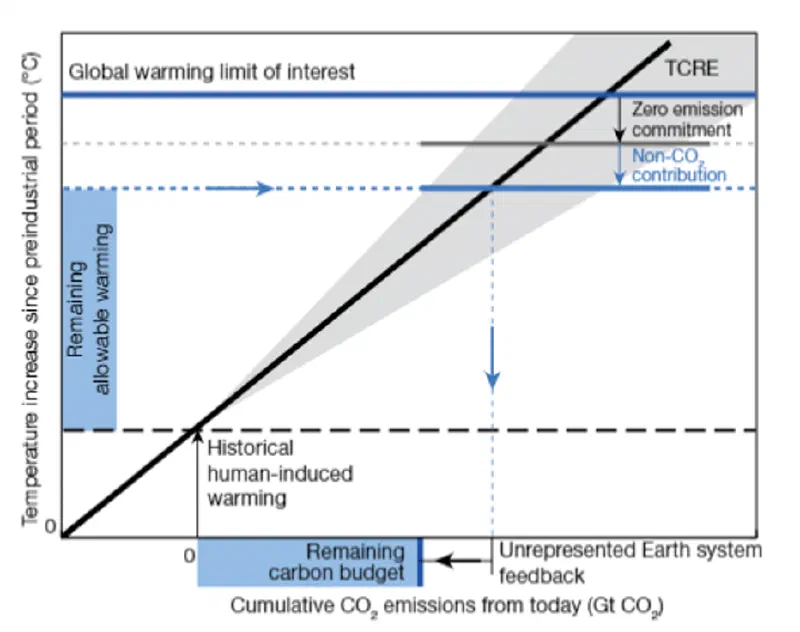
Table 1. The assessed remaining allowed CO2 emissions (in GtCO2) through December 31, 2022. Values are given in terms of the 33rd, 50th and, 67th percentile of TCRE (transient climate response to cumulative carbon emissions).
The latest estimates of the remaining carbon budget are small (e.g., 400 Gt CO2 for a 67% probability of limiting the warming below 1.5°C). Matthews et al. (2020) note that “there is nevertheless a reasonable chance that the Paris Agreement goals remain within reach. However, this window of opportunity is closing with each passing year of tentative and insufficient action”. It must be noted that these analyses do not consider non-CO2 emissions that would likely significantly reduce the amount of allowed emissions, as discussed in the next section, and further considered in the updates for 2020, 2021, and 2022 emissions.
Based on the Global Carbon Project analyses (Friedlingstein et al. 2020, 2022), emissions of CO2 from fossil fuel combustion, industrial processes, and land-use change (summed) for 2020 are 38.5 GtCO2 (as compared to 40.8 GtCO2 in 2019). The estimated emissions fell by about 7% in 2020, with this decrease largely thought to be a result of the COVID-19 pandemic (Le Quéré et al. 2020).
Friedlingstein et al. (2022) and EIA (2022) both estimate that the fossil fuel emissions in 2021 were higher than those in 2020. Inclusion of CO2 from industrial processes and land-use change results in an estimated total of 40.2 GtCO2 (Friedlingstein et al. 2022). IEA (2022) analysis shows that CO2 emissions were to increase by close to 300 million tonsnes in 2022 – a far smaller rise than their jump of nearly 2 billion tonsnes in 2021, which resulted from the rapid global recovery from the economic crisis triggered by the pandemic. Friedlingstein et al. (2022) indicated that fossil CO2 emissions continued to increase by 1.0 % in 2022 relative to 2021, slightly above the 2019 level. Their total emissions for 2022 were 40.0 GtCO2 (Friedlingstein et al. 2022).
For each of the three years (2020 through 2022), Table 1 shows the assessed remaining allowed CO2 emissions (in GtCO2). Note that since the last three years only represent carbon dioxide emissions, these values are shown in parentheses; the values are also rounded to reduce the significant figures. After December 2022, accounting only for CO2 emissions reduces the 50% probability for reaching 1.5°C to 381 GtCO2 and for the more definitive 67 percentile to 281 GtCO2. At the current rate of emissions, the limit on allowed emissions will occur in less than a decade for the 50th and 67th percentiles, and in less than 15 years for the 33rd percentile.
The role of non-CO2 gases
Emissions of non-CO2 greenhouse gases are also important in the calculation of overall response of climate under mitigation scenarios (e.g., 1.5°C) (IPCC 2018, 2021). The long-lived greenhouse gases most often considered include nitrous oxide (N2O) and some fluorinated gases. Methane (CH4) has a lifetime of roughly 10 years and is 120 times more effective radiatively than CO2 immediately after being emitted (Balcombe et al. 2018). If major human emissions were to be stopped, CH4 would return to lower concentrations within a few decades. The suite of shorter-lived climate forcers (SLCFs) include methane, some fluorinated gases, ozone (O3), and aerosols – all contribute significantly to the radiative forcing affecting current and projected temperatures.
These non-CO2 forcing agents contribute differently to net non-CO2 uncertainties; for example, in IPCC AR5 the present-day level of forcing from N2O is assigned a ‘very high’ level of confidence; CH4, fluorinated gases, aerosols and aerosol precursors are assigned a ‘high’ level of confidence; and ozone and precursors are given a ‘medium’ level of confidence (IPCC, 2014). ‘Levels of confidence’ in present-day forcings do not translate to uncertainties in forward emission scenarios but are indicative of the state of scientific understanding of these non-CO2 forcing agents.
To summarize the overall role of non-CO2 forcers on temperature goals, not reducing non-CO2 forcing levels results in a significantly lower chance of limiting warming to 1.5°C for a given level of cumulative CO2 emissions (see Figure 2 as well as the conceptual Figure SPM1 in IPCC (2018)).
Future emissions of methane, nitrous oxide, aerosols, and other climate forcings are highly uncertain, but they are not expected to either decrease or increase rapidly. As the use of fossil fuels decreases, the relative influence of these components on the remaining carbon budget increases.
Chapter 2 in IPCC (2022) evaluates the equivalent CO2 for 2019 from CH4, N2O and longer-lived fluorocarbons as just over 5.2 GtCO2-eq (for non-CO2 gases this means the emission values are scaled by the 100-year global warming potentials for the given gas, which tends to underestimate short term effects on climate). Olivier (20222 suggests that the emissions of these gases could be somewhat larger. The IPCC value for 2019 is used here and it is assumed this level applies to 2020 through 2022. Effects from other gases and particles are not considered – these might have reduced the remaining CO2-eq even further.
The net results in Table 1 show that the non-CO2 gases reduce the December 2022 analysis for the 50% probability for reaching 1.5°C to 366 GtCO2 and for the more definitive 67 percentile % probability to 266 GtCO2.
Other factors affecting when 1.5°C is reached
Time period
Some human anthropogenic emissions and associated warming are likely to have occurred by the late-1800s. If the aim is to really account for the carbon emissions since the beginning of the industrial revolution, then roughly another 5-10 Gt CO2 and perhaps more should be subtracted to more realistically account for past emissions.
Feedbacks in emissions and associated uncertainties
In addition to remaining uncertainties in the recent CO2 and other greenhouse gas (GHG) emissions, there is some amount of global mean temperature change expected to occur after a complete cessation of CO2 equivalent emissions, reflecting the slow response of land ice and heat accumulation in the deep ocean, as well as climate carbon cycle feedbacks is referred to as the ‘Zero Emissions Commitment’ (ZEC) (Jones et al. 2019, MacDougall et al. 2020). The ZEC is uncertain and likely close to zero, meaning that the temperature impact of the historical cumulative CO2 emissions is expected to stay roughly constant after CO2 emissions have ceased (MacDougall et al. 2020).
Earth-system feedbacks like such as thawing permafrost or other factors like burning wildfires and tundra could also affect future levels of carbon in the atmosphere. These feedbacks are normally not considered in the modeling studies of future temperature change (and therefore not included in the ZEC estimates), but the IPCC (2021) takes these feedbacks into account in the estimate of the remaining carbon budget through linear feedback analysis, with the assumption that these feedbacks reduce the budget by 26 ± 97 GtCO2 per °C-1. In addition, remaining uncertainties in the natural sources and sinks in the carbon cycle also could affect estimates of the budget of remaining allowed CO2 emissions. These uncertainties are large but difficult to quantify and are not fully considered in evaluating the future CO2 emission limits.
Estimated emission limits also assume that potential impacts from natural changes in climate forcing, such as those from major changes in solar flux or from a series of large volcanic eruptions, will not occur during this time period, and that there will be no major changes from unforced natural variability.
Transient Climate Response and Equilibrium Climate Sensitivity
The uncertainties in the TCR and the ECS affect both the future projections of temperature change and hence the estimates of acceptable carbon emissions. The TCR accounts for the rapid response after a forcing on climate – it is defined by the increase in global average temperature expected at a time when the atmospheric concentration of CO2 has doubled. Correspondingly, ECS corresponds to the long-term increase in global average temperature expected to occur after the effects of a doubled CO2 concentration have had time to reach a steady state. ECS is an important quantity used to estimate how the climate responds to radiative forcing. Based on multiple lines of evidence, the very likely range of equilibrium climate sensitivity to a doubling in CO2, relative to preindustrial levels, is between 2°C (high confidence) and 5°C (medium confidence). The IPCC AR6 WG1 Report (2021) assessed that the best estimate is 3°C with a likely range of 2.5°C to 4°C (high confidence). The uncertainty in TCRE and ECS are major factors in the probability ranges given in our estimated limits on remaining carbon emissions. Because of the slow response of land ice and the heat accumulation in the deep ocean, reaching an equilibrium temperature could take many centuries after CO2 has doubled.
Scenarios for future emissions
Projections of future changes in climate are typically presented for a range of plausible pathways, scenarios, or targets that capture the relationships between human choices, emissions, concentrations, and temperature change. Some scenarios are consistent with continued dependence on fossil fuels, while others can only be achieved by deliberate actions to reduce emissions. The resulting range reflects the uncertainty inherent in quantifying human activities (including technological change) and their influence on climate.
The time-dependent scenarios called Representative Concentration Pathways or RCPs were developed in 2010 (Moss et al. 2010). While prior scenarios were emissions scenarios, RCPs are radiative forcing scenarios (radiative forcing refers to the changes in atmospheric properties that drive changes in climate and corresponds to the forcing resulting from changes in atmospheric concentrations of heat trapping gases and particles). Each scenario is tied to one value: the change in radiative forcing at the tropopause by 2100 relative to preindustrial levels. The five RCPs originally used were numbered according to the change in radiative forcing by 2100: +1.9, +2.6, +4.5, +6.0 and +8.5 watts per square meter (W/m2) (van Vuuren et al. 2011; Thomson et al. 2011; Masui et al. 2011; Riahi et al. 2011). RCP1.9 is designed to correspond to a 50% likelihood of keeping human-related climate change at 1.5°C. These scenarios were used in the IPCC 5th assessment (IPCC 2013, 2014).
A broad range of socioeconomic scenarios were developed independently from the RCPs and a subset of these are constrained using emissions limitations policies consistent with their underlying storylines, to create five Shared Socioeconomic Pathways (SSPs) with climate forcing that matches the RCP values. These SSPs consider a range of criteria such as population, economic growth, education, urbanization, and the rate of technological development. This pairing of SSPs and RCPs is designed to meet the needs of the impacts, adaptation, and vulnerability (IAV) communities, enabling them to couple alternative socioeconomic scenarios with the climate scenarios developed using RCPs to explore the socioeconomic challenges to climate mitigation and adaptation (O’Neill et al. 2014, 2016). The SSP1-1.9 scenario is a close analog to the RCP1.9 scenario. The SSP scenarios were used in the global Earth system Modeling studies for the 6th IPCC assessment (IPCC 2021).
The SSP1-1.9 scenario assumes a rapid drop in emissions starting in the early 2020s and going to zero emissions by 2050, and thenwith negative emissions for the rest of this century, meaning that there is significant removal of carbon from the atmosphere during those decades. The large carbon budget uncertainty and reliance on negative emissions – basically, removing CO2 from the atmosphere and permanently storing it – could make the idea of a carbon budget of limited use for strict mitigation targets such as 1.5oC. However, within reasonable emissions choices, the choice of scenario does not significantly affect the total CO2 emissions allowed before a given temperature change eventually would be reached, but the use of negative emissions could affect the timing for when it would be reached (Rogelj et al. 2018b).
Discussion and Conclusions
Analysis of the temperature record and observed trends over recent decades suggests that 1.5°C will be reached in one to two decades, by 2032 to 2042. A series of El Niño events could get the climate trends to 1.5°C sooner, but the number of events would have to exceed what we have seen in recent decades.
The second approach examined, through a conservative approach, the equivalent amount of CO2 in GtCO2-eq that could still be emitted into the atmosphere by human activities without exceeding global mean surface temperature increase of 1.5°C. The analyses in Table 1 show a range of 266 to 531 GtCO2-eq still allowed for 67% to 33%, respectively, of staying at or below the temperature limit. For a 50% likelihood of staying at 1.5°C or less, allowed emissions would be 366 GtCO2-eq. At the current rate of emissions, 45 GtCO2-eq for 2022, the limit would be reached within 8 years.
IPCC (2021) analyses suggested emissions would need to peak before 2025 and a 43% cut in global emissions is needed by 2030 to keep within the possibility of the 1.5°C limit. However, what will happen with emissions in 2023 and beyond remain highly uncertain. Some analysts suggest carbon emissions may level out for the next few years, basically with a slow economy and the switch to carbon-free energy and transportation offsetting increasing demand for fossil fuels to level carbon emissions (https://www.scientificamerican.com/article/will-global-emissions-plateau-in-2023-four-trends-to-watch/).
Could a significant reduction in emissions keep the 1.5°C limit within reach? A 43% cut in global emissions by 2030 – roughly a 6% decrease per year, while possible, is not likely, especially if the global emissions over the next few years are possibly going to be about the same as 2022. To look at the possible effects of reducing emissions, an emissions reduction of 4% per year is considered, with the assumption that this reduction begins in January 2023. In this case, the 67% likelihood for staying within the 1.5°C limit is passed in 2030 and the 50% likelihood is passed in 2035. The 33% likelihood is passed in 2044.
These analyses suggests that the emission limits needed to constrain the temperature change to 1.5°C, at 50% probability, is likely to be reached before 2035 unless globally emissions are greatly reduced by more than 4% per year starting in early 2023. Based on both the temperature trend analysis and the remaining carbon analysis, humanity is very unlikely to meet the identified targets needed to keep the changes in climate within 1.5°C.
Given the above, the SSP1-1.9 emissions assumptions are also extremely unlikely unless means to further limit GHG additions to the atmosphere and to lower atmospheric GHG concentrations are put in place. In theory, it may be possible to reverse global warming through the technological interventions called geoengineering. Two types of geoengineering approaches have been proposed: 1) removal of carbon dioxide from the atmosphere (NAS, 2015a), and 2) altering the amount of the Sun’s energy that reaches the Earth (referred to as “solar radiation management”) (NAS, 2015b).
Various techniques for removal of CO2 from the atmosphere, the longest-lived of the heat-trapping gases, have been proposed and some are being tested. At this time, however, there is no indication that any of them could be implemented on a large enough scale efficiently enough to have a significant effect without the global community agreeing to accept the effects on the world economy. Investments in limiting emissions, combined with capturing and storing carbon, could possibly reverse the warming trend, but it remains to be seen if this is feasible at large enough scale.
Artificial injection of stratospheric particles and cloud brightening are two examples of “solar radiation management” techniques. The cooling effect that some types of particles have on the atmosphere has led to the proposal of an array of possible geoengineering projects, especially with the goal of offsetting the warming until more non-fossil fuel energy is put into place. However, the climate system is complex and experimenting without complete understanding could result in unintended and potentially dangerous side effects on our health, ecosystems, agricultural yields, and even the climate itself. Even if such engineering approaches are determined to be technically and economically feasible, the potential impacts on the environment must be better understood. One important consideration regarding solar radiation management is that ocean acidification will still continue even if warming could be reduced. Much more research is needed to see if such approaches could be environmentally feasible. In the meantime, there are significant concerns about ecological and other side effects of some of these technologies. We only have one planet to experiment with: we cannot afford to get it wrong.
References
Allen M.R., D.J. Frame, C. Huntingford, C.D. Jones, J.A. Lowe, M. Meinshausen and N. Meinshausen, 2009: Warming caused by cumulative carbon emissions towards the trillionth tonne. Nature, 458, 1163–66.
Balcombe, P., J.F. Speirs, N.P. Brandon, and A.D. Hawkes, 2018: Methane emissions: choosing the right climate metric and time horizon. Environ. Sci. Process. Impacts, 20, 1323-1339.
Friedlingstein P., and 85 others, 2020: Global carbon budget 2020. Earth Syst. Sci. Data 12, 3269–3340 https://doi.org/10.5194/essd-12-3269-2020.
Friedlingstein, P., M. O'Sullivan, M.W. Jones, R.M. Andrew, et al., 2022: Global Carbon Budget 2022, Earth Syst. Sci. Data, 14, 4811–4900, https://doi.org/10.5194/essd-14-4811-2022.
Hawkins, E., P. Ortega, E. Suckling, A. Schurer, G. Hegerl, P. Jones, M. Joshi, T.J. Osborn, V. Masson-Delmotte, J. Mignot, P. Thorne, and G.J. van Oldenborgh, 2017: Estimating changes in global tmperature since the preindustrial period. Bulletin of the American Meteorological Society, 98, 1841-1856, 2017. http://dx.doi.org/10.1175/BAMS-D-16-0007.1.
Intergovernmental Panel on Climate Change (IPCC), 2013: Climate Change 2013: The Physical Science Basis. Contribution of Working Group I to the Fifth Assessment Report of the Intergovernmental Panel on Climate Change [Stocker, T. F., D. Qin, G.-K. Plattner, M. Tignor, S. K. Allen, J. Boschung, A. Nauels, Y. Xia, V. Bex and P. M. Midgley (eds.)]. Cambridge University Press, Cambridge, United Kingdom and New York, NY, USA.
Intergovernmental Panel on Climate Change (IPCC), 2014: Climate Change 2014: Synthesis Report. Contribution of Working Groups I, II and III to the Fifth Assessment Report of the Intergovernmental Panel on Climate Change [Core Writing Team, R.K. Pachauri and L.A. Meyer (eds.)]. IPCC, Geneva, Switzerland, 151 pp.
Intergovernmental Panel on Climate Change (IPCC), 2018: Global warming of 1.5°C. An IPCC Special Report on the impacts of global warming of 1.5°C above pre-industrial levels and related global greenhouse gas emission pathways, in the context of strengthening the global response to the threat of climate change, sustainable development, and efforts to eradicate poverty [V. Masson-Delmotte, P. Zhai, H. O. Pörtner, D. Roberts, J. Skea, P.R. Shukla, A. Pirani, W. Moufouma-Okia, C. Péan, R. Pidcock, S. Connors, J. B. R. Matthews, Y. Chen, X. Zhou, M. I. Gomis, E. Lonnoy, T. Maycock, M. Tignor, T. Waterfield (eds.)]. IPCC, Geneva, Switzerland.
Intergovernmental Panel on Climate Change (IPCC), 2021: Climate Change 2021: The Physical Science Basis. Working Group I contribution to the Sixth Assessment Report of the Intergovernmental Panel on Climate Change, Cambridge University Press, Cambridge, United Kingdom and New York, NY, USA, https://dx.doi.org/10.1017/9781009157896.
Intergovernmental Panel on Climate Change (IPCC), 2021: Climate Change 2022: Mitigation of Climate Change. Contribution of Working Group III to the Sixth Assessment Report of the Intergovernmental Panel on Climate Change [P.R. Shukla, J. Skea, R. Slade, A. Al Khourdajie, R. van Diemen, D. McCollum, M. Pathak, S. Some, P. Vyas, R. Fradera, M. Belkacemi, A. Hasija, G. Lisboa, S. Luz, J. Malley, (eds.)]. Cambridge University Press, Cambridge, UK and New York, NY, USA. doi: 10.1017/9781009157926.
International Energy Agency (IEA), 2022a: Global Energy Review: CO2 Emissions in 2021. https://www.iea.org/reports/global-energy-review-co2-emissions-in-2021-2.
International Energy Agency (IEA), 2022b: Defying expectations, CO2 emissions from global fossil fuel combustion are set to grow in 2022 by only a fraction of last year’s big increase. News release, October 19, 2022. https://www.iea.org/news/defying-expectations-co2-emissions-from-global-fossil-fuel-combustion-are-set-to-grow-in-2022-by-only-a-fraction-of-last-year-s-big-increase.
Jones C. D., T.L. Frölicher, C. Koven, A.H. MacDougall, H.D. Matthews, K. Zickfeld , J. Rogelj, K. B. Tokarska, N.P. Gillett, T. Ilyina, M. Meinshausen, N. Mengis, R. Séférian, M. Eby and F.A. Burger, 2019: The Zero Emissions Commitment Model Intercomparison Project (ZECMIP) contribution to C4MIP: quantifying committed climate changes following zero carbon emissions. Geosci. Model Dev., 12, 4375–4385, https://doi.org/10.5194/gmd-12-4375-2019.
Lahn B., 2020: A history of the global carbon budget. WIREs Climate Change, 11, e636 https://doi.org/10.1002/wcc.636.
Le Quéré, J.R.B., M.W. Jones, A.J.P. Smith, S. Abernethy, R.M. Andrew, A.J. De-Gol, D.R. Willis, Y. Shan, J.G. Canadell, P. Friedlingstein, F. Creutzig and G.P. Peters, 2020: Temporary reduction in daily global CO2 emissions during the COVID-19 forced confinement. Nature Climate Change, DOI: 10.1038/s41558-020-0797-x.
MacDougall A.H., T.L. Frölicher, C.D. Jones, J. Rogelj, H.D. Matthews, K. Zickfeld, V.K. Arora, N.J. Barrett, V. Brovkin, F.A. Burger, M. Eby, A.V. Eliseev, T. Hajima, P.B. Holden, A. Jeltsch-Thömmes, C. Koven, N. Mengis, L. Menviel, M. Michou, I.I. Mokhov, A. Oka, J. Schwinger, R. Séférian, G. Shaffer, A. Sokolov, K. Tachiiri, J. Tjiputra , A. Wiltshire and T. Ziehn, 2020: Is there warming in the pipeline? A multi-model analysis of the Zero Emissions Commitment from CO2. Biogeosciences 17, 2987–3016, https://doi.org/10.5194/bg-17-2987-2020.
Mace, M. J., 2016: Mitigation commitments under the Paris Agreement and the way forward. Climate Law, 6, 21–39.
Masui, T., K. Matsumoto, Y. Hijioka, T. Kinoshita, T. Nozawa, S. Ishiwatari, E. Kato, P.R. Shukla, Y. Yamagata, and M. Kainuma, 2011: An emission pathway for stabilization at 6 Wm−2 radiative forcing. Climatic Change, 109, 59. http://dx.doi.org/10.1007/s10584-011-0150-5.
Matthews, H.D., N.P. Gillett, P.A. Stott and K. Zickfeld, 2009: The proportionality of global warming to cumulative carbon emissions. Nature, 459, 829–33.
Matthews, H.D., K.B. Tokarska, Z.R.J. Nicholls, J. Rogelj, J.G. Canadell, P. Friedlingstein, T.L. Frolicher, P.M. Forster, N.P. Gillett, T. Ilyina, R.B. Jackson, C.D. Jones, C. Koven, R. Knutti, A.H. MacDougall, M. Meinshausen, N. Mengis, R. Seferian and K. Zickfeld, 2020: Opportunities and challenges in using remaining carbon budgets to guide climate policy. Nature Geoscience, 13, 769-779.
Meinshausen, M., N. Meinshausen, W. Hare, S.C.B. Raper, K. Freiler, R. Knutti, D. J. Frame and M.R. Allen, 2009: Greenhouse-gas emission targets for limiting warming to 2oC. Nature, 458, 1158–62.
Millar, R.J., J.S. Fuglestvedt, P. Friedlingstein, et al., 2017: Emission budgets and pathways consistent with limiting warming to 1.5 °C. Nature Geoscience, 10, 741-747, https://doi.org/10.1038/ngeo3031.
Moss, R.H., J.A. Edmonds, K.A. Hibbard, M.R. Manning, S.K. Rose, D.P. van Vuuren, T.R. Carter, S. Emori, M. Kainuma, T. Kram, G.A. Meehl, J.F.B. Mitchell, N. Nakicenovic, K. Riahi, S.J. Smith, R.J. Stouffer, A.M. Thomson, J.P. Weyant, and T.J. Wilbanks, 2010: The next generation of scenarios for climate change research and assessment. Nature, 463, 747-756. https://dx.doi.org/10.1038/nature08823.
National Academy of Sciences (NAS), 2015a: Climate Intervention: Carbon Dioxide Removal and Reliable Sequestration. The National Academies Press, Washington, DC, 154 pp. https://dx.doi.org/10.17226/18805.
National Academy of Sciences (NAS), 2015b: Climate Intervention: Reflecting Sunlight to Cool Earth. The National Academies Press, Washington, DC, 260 pp. http://dx.doi.org/10.17226/18988.
NOAA, 2023a: Annual 2022 Global Climate Report. https://www.ncei.noaa.gov/access/monitoring/monthly-report/global/202213.
NOAA, 2023b, NOAAGlobalTemp. https://www.ncei.noaa.gov/products/land-based-station/noaa-global-temp.
Olivier, J.G.J., 2022: Trends in Global CO2 and Total Greenhouse Gas Emissions. PBL Netherlands Environmental Assessment Agency, The Hague, https://www.pbl.nl/en/publications/trends-in-global-co2-and-total-greenhouse-gas-emissions-2021-summary-report.
O’Neill, B.C., E. Kriegler, K. Riahi, K.L. Ebi, S. Hallegatte, T.R. Carter, R. Mathur, and D.P. van Vuuren, 2014: A new scenario framework for climate change research: The concept of shared socioeconomic pathways. Climatic Change, 122, 387-400. https://dx.doi.org/10.1007/s10584-013-0905-2.
O'Neill, B. C., Tebaldi, C., van Vuuren, D.P., Eyring, V., Friedlingstein, P., Hurtt, G., Knutti, R., Kriegler, E., Lamarque, J.-F., Lowe, J., Meehl, G.A., Moss, R., Riahi, K., and Sanderson, B. M., 2016: The Scenario Model Intercomparison Project (ScenarioMIP) for CMIP6. Geosci. Model Dev., 9, 3461-3482.
Rajamani L., and J. Werksman, 2018: The legal character and operational relevance of the Paris Agreement’s temperature goal. Phil. Trans. R. Soc. A, 376, 20160458. https://doi.org/10.1098/rsta.2016.0458.
Riahi, K., S. Rao, V. Krey, C. Cho, V. Chirkov, G. Fischer, G. Kindermann, N. Nakicenovic, and P. Rafaj, 2011: RCP 8.5—A scenario of comparatively high greenhouse gas emissions. Climatic Change, 109, 33-57. https://dx.doi.org/10.1007/s10584-011-0149-y.
Rogelj J., D. Shindell K. Jiang, S. Fifita, P. Forster, V. Ginzburg, C. Handa, H. Kheshgi, S. Kobayashi, E. Kriegler, L. Mundaca, R. Séférian and M.V. Vilariño, 2018a: Mitigation Pathways Compatible with 1.5°C in the Context of Sustainable Development. In: Global Warming of 1.5°C. An IPCC Special Report on the impacts of global warming of 1.5°C above pre-industrial levels and related global greenhouse gas emission pathways, in the context of strengthening the global response to the threat of climate change, sustainable development, and efforts to eradicate poverty [Masson-Delmotte, V., P. Zhai, H.-O. Pörtner, D. Roberts, J. Skea, P.R. Shukla, A. Pirani, W. Moufouma-Okia, C. Péan, R. Pidcock, S. Connors, J.B.R. Matthews, Y. Chen, X. Zhou, M.I. Gomis, E. Lonnoy, T. Maycock, M. Tignor, and T. Waterfield (eds)]. IPCC, Geneva, Switzerland.
Rogelj J., A. Popp , K.V. Calvin, G. Luderer, J. Emmerling, D. Gernaat, S. Fujimori, J. Strefler, T. Hasegawa, G. Marangoni, V. Krey, E. Kriegler, K. Riahi, D.P. van Vuuren, J. Doelman, L. Drouet, J. Edmonds, O. Fricko, M. Harmsen, P. Havlik, F. Humpenoeder, E. Stehfest and M. Tavoni, 2018b: Scenarios towards limiting global mean temperature increase below 1.5 degrees C. Nature Climate Change, 8, 325-332, ISSN: 1758-678X.
Rogelj J., P.M. Forster, E. Kriegler, et al., 2019: Estimating and tracking the remaining carbon budget for stringent climate targets. Nature, 571, 335–342. https://doi.org/10.1038/s41586-019-1368-z.
Rohde, R.A., and Z. Hausfather, 2020: The Berkeley Earth Land/Ocean Temperature Record. Earth Syst. Sci. Data, 12, 3469-3479, https://doi.org/10.5194/essd-12-3469-2020.
Schleussner, C.-F., J. Rogelj, M. Schaeffer, et al., 2016: Science and policy characteristics of the Paris Agreement temperature goal. Nature Climate Change 6, 827–835. https://doi.org/10.1038/nclimate3096.
Schmidt, G., 2023: 2022 update to the temperature records. RealClimate, 13January 2023, https://www.realclimate.org/index.php/archives/2023/01/2022-updates-to-the-temperature-records/.
Smith, C. J., R.J. Kramer, G. Myhre, K. Alterskjær, W. Collins, A. Sima A., O. Boucher, J.-L. Dufresne, P. Nabat, M. Michou, S. Yukimoto, J. Cole, D. Paynter, H. Shiogama, F.M. O'Connor, E. Robertson, A. Wiltshire, T. Andrews, C. Hannay, R.L. Miller, L. Nazarenko, A. Kirkevåg, D. Olivié, S. Fiedler, R. Pincus and P.M. Forster, 2020: Effective radiative forcing and adjustments in CMIP6 models. Atmos. Chem. Phys., 20, 9591-9618, doi:10.5194/acp-20-9591-2020.
Thomson, A.M., K.V. Calvin, S.J. Smith, G.P. Kyle, A. Volke, P. Patel, S. Delgado-Arias, B. Bond-Lamberty, M.A. Wise, and L.E. Clarke, 2011: RCP4.5: A pathway for stabilization of radiative forcing by 2100. Climatic Change, 109, 77-94. https://dx.doi.org/10.1007/s10584-011-0151-4.
United Nations Framework Convention on Climate Change (UNFCCC), 2010: The Cancun Agreements: Outcome of the work of the Ad Hoc Working Group on Long-term Cooperative Action under the Convention. The sixteenth session of the Conference of the Parties to the UNFCCC; 2010 Nov. 29–Dec. 10; Cancun, Mexico. https://unfccc.int/process/conferences/pastconferences/cancun-climate-change-conference-november-2010/statements-and-resources/Agreements.
United Nations Framework Convention on Climate Change (UNFCCC), 2016: The Paris Agreement. https://unfccc.int/sites/default/files/resource/parisagreement_publication.pdf.
van Vuuren, D.P., S. Deetman, M.G.J. den Elzen, A. Hof, M. Isaac, K. Klein Goldewijk, T. Kram, A. Mendoza Beltran, E. Stehfest, and J. van Vliet, 2011: RCP2.6: Exploring the possibility to keep global mean temperature increase below 2°C. Climatic Change, 109, 95-116. https://dx.doi.org/10.1007/s10584-011-0152-3.
WBGU, 2009: Solving the climate dilemma: the budget approach, Special Report of the German Advisory Council on Global Change (WBGU) Berlin https://www.wbgu.de/en/special-reports/sr-2009-budget-approach/.
World Meteorological Organization (WMO), 2023: Provisional State of the Global Climate 2022. https://public.wmo.int/en/our-mandate/climate/wmo-statement-state-of-global-climate.
Zickfeld, K., M. Eby, H.D. Matthews and A.J. Weaver, 2009: Setting cumulative emissions targets to reduce the risk of dangerous climate change. Proc. Nat. Acad. Sci. 106, 16129–34.
Disclaimer
The Earth Knowledge Blog is provided for general informational purposes only and is not meant to address specific climate conditions, risks, regions or time periods or to provide recommendations for any specific uses, actions or applications. You should not rely on the material or information in this Blog as the basis for any risk assessment, or to make any business, operational or other decision.